
AUTO
Tata Edges Mahindra in July PVs as Diversified Arms Drive 26% Surge
Tata led Mahindra by 2563 domestic PVs in July 2026 while Mahindra’s SUVs, CVs, three-wheelers and tractors delivered 26% overall growth and breadth rivals lack.

Mahindra & Mahindra posted 60,048 domestic SUVs and 103,860 total vehicles in July 2026, lifting SUVs 20 percent and overall auto sales 26 percent year on year. Tata Motors still took the domestic passenger-vehicle silver medal by a narrow 2,563 units.
The gap is real. The story underneath it is wider. Mahindra’s commercial vehicles, three-wheelers and tractors turned a flat-ish SUV month into a multi-segment advance that pure car makers cannot copy.
That six-point spread between SUV growth and total auto growth is the clearest monthly signal of the portfolio effect. Utility vehicles held near the prior month’s level. Everything else pulled the company-wide number higher.
Tata Holds Second by a Whisker
Autocar India tallied the July domestic passenger-vehicle scoreboard. Maruti Suzuki ran away with 196,203 units, up 42 percent. Tata followed at 62,611, up 58 percent. Mahindra sat third at 60,048, up 20 percent. Hyundai recovered to 54,210 after a June supplier fire.
| Carmaker | July 2026 | June 2026 | MoM % | July 2025 | YoY % |
|---|---|---|---|---|---|
| Maruti Suzuki | 196,203 | 147,187 | 33.3 | 137,776 | 42.4 |
| Tata Motors | 62,611 | 62,076 | 0.9 | 39,521 | 58.4 |
| Mahindra | 60,048 | 60,393 | -0.6 | 49,871 | 20.4 |
| Hyundai | 54,210 | 39,635 | 36.8 | 43,966 | 23.3 |
| Toyota | 30,516 | 28,441 | 7.3 | 29,159 | 4.7 |
Maruti’s haul alone exceeded the combined total of Tata, Mahindra and Hyundai. That single fact framed the month for many observers on X. Tata’s Punch hit a record and its EVs cleared 15,000 wholesales for the first time. Mahindra stayed almost entirely in utility vehicles and still nearly matched Tata’s overall PV number.
Month on month the ranking was almost static at the top. Tata edged up 0.9 percent from June. Mahindra eased 0.6 percent. Hyundai’s 36.8 percent rebound from the fire-hit June base was the sharpest sequential move among the top five. Toyota’s 7.3 percent gain kept it a distant fifth.
The year-on-year column tells a different story. Tata’s 58.4 percent leap came off a low July 2025 base of 39,521. Mahindra’s 20.4 percent rise came off a much higher base of 49,871. Absolute volume, not percentage, is what kept the silver-medal fight this tight.
Sixty Thousand SUVs Become the New Floor
Domestic utility-vehicle sales of 60,048 units sat just 345 units below June’s 60,393 domestic SUVs. Including exports the July SUV total reached 60,887. Year to date through July the company has sold 234,793 passenger vehicles, up 16 percent from 201,938 a year earlier.
- 20 percent YoY SUV growth on a high base
- 0.57 percent sequential dip after two straight 60k-plus months
- 16 percent April-July passenger-vehicle growth
Nalinikanth Gollagunta, CEO of the Automotive Division, put the numbers in plain language.
In July we achieved SUV sales of 60,048 units delivering growth of 20%. The total vehicle sales stood at 103,860, a 26% YoY growth reflecting all-round demand traction across the portfolio.
The company does not break out individual model volumes in the monthly release. Earlier months showed Scorpio, Thar, XUV 3XO, XUV 7XO and Bolero each clearing roughly 9,000-14,000 units. That five-model floor remains the operational reality.
Three consecutive months near 60,000 domestic SUVs change how the market reads the brand. A single strong print can be a launch spike. A tight band held across a price hike and a soft sequential month looks like capacity and demand in balance. The five nameplates share that load rather than leaving one hero model to carry the month.
Exports added another 839 units to the July SUV tally. That is a modest share of the 60,887 combined figure, yet it shows the utility range travels. The domestic floor still does the heavy lifting.
Commercial Vehicles and Three-Wheelers Carry the Extra Weight
The 26 percent overall auto gain did not come from SUVs alone. Domestic commercial-vehicle sales rose 23 percent to 25,204 units. Light commercial vehicles under 2 tonnes jumped 40 percent to 3,870. The 2-to-3.5-tonne band grew 21 percent to 21,334. Three-wheelers, including electric models from the last-mile subsidiary, surged 53 percent to 14,538 units. Cumulative three-wheeler sales for the fiscal year are already up 69 percent.
| Segment (Domestic) | July 2026 | July 2025 | YoY % | YTD July 2026 | YTD % |
|---|---|---|---|---|---|
| Utility Vehicles | 60,048 | 49,871 | 20 | 234,793 | 16 |
| LCV <2T | 3,870 | 2,763 | 40 | 13,852 | 31 |
| LCV 2-3.5T | 21,334 | 17,701 | 21 | 84,934 | 19 |
| 3 Wheelers (incl. EV) | 14,538 | 9,475 | 53 | 50,793 | 69 |
| Total Exports | 4,070 | 2,774 | 47 | 19,958 | 60 |
Exports of 4,070 vehicles rose 47 percent. The note on the release confirms total vehicle sales of 103,860 fold in SUVs, LCVs under 3.5 tonnes, three-wheelers and exports. That mix is the practical difference between Mahindra and a pure passenger-vehicle rival.
Stack the July domestic pieces and the pattern is plain. Utility vehicles supplied the volume base. The two LCV bands together added 25,204 units. Three-wheelers contributed another 14,538. None of those commercial and last-mile lines appear on a pure car maker’s monthly sheet.
- LCV under 2 tonnes: fastest commercial growth at 40 percent YoY
- LCV 2-to-3.5 tonnes: largest commercial volume block at 21,334
- Three-wheelers: highest segment growth rate at 53 percent YoY
- Exports: 47 percent YoY on a still-small base of 4,070
Year-to-date three-wheeler growth of 69 percent outruns every other line in the table. Last-mile electrification inside that number is part of the story. The broader point is demand breadth. Freight, passenger last-mile and export channels all moved in the same direction in July.
Tractors and Trucks Add the Rural and Infrastructure Layer
Farm equipment delivered another clean print. Domestic tractor sales reached 32,643 units, up 21 percent from 26,990. Including exports the tractor total hit 34,420, up 20 percent. April-July domestic tractors stand at 185,069, up 19 percent. Veejay Nakra, President of the Farm Equipment Business, pointed to improved rainfall, better reservoir levels, faster kharif sowing and healthier farm cash flows.
The trucks and buses business (Mahindra Trucks & Buses plus SML Mahindra) sold 3,009 vehicles, up 19 percent. Cargo rose 15 percent to 1,474; passenger versions rose 23 percent to 1,535. Infrastructure spend and fleet replacement continue to feed the segment even with cost pressure.
These numbers rarely lead the headlines. They explain why total auto growth outpaced the SUV line by six points.
Tractors alone at 32,643 domestic units nearly equal half the SUV print. Add the 3,009 trucks and buses and the rural-plus-infrastructure layer clears 35,000 units in a single month. That is a second engine running beside the automotive division, not a footnote.
Passenger versions inside trucks and buses grew faster than cargo in July, 23 percent against 15 percent. Fleet replacement and public-mobility demand both appear in that split. Cost pressure has not stopped the orders.
A Mid-Month Price Hike and an August Scorpio Refresh
Mahindra implemented an average 2.7 percent SUV price increase and 2 percent on commercial vehicles effective 10 July, citing commodity costs. Volumes still held above 60,000. Demand absorbed the step-up.
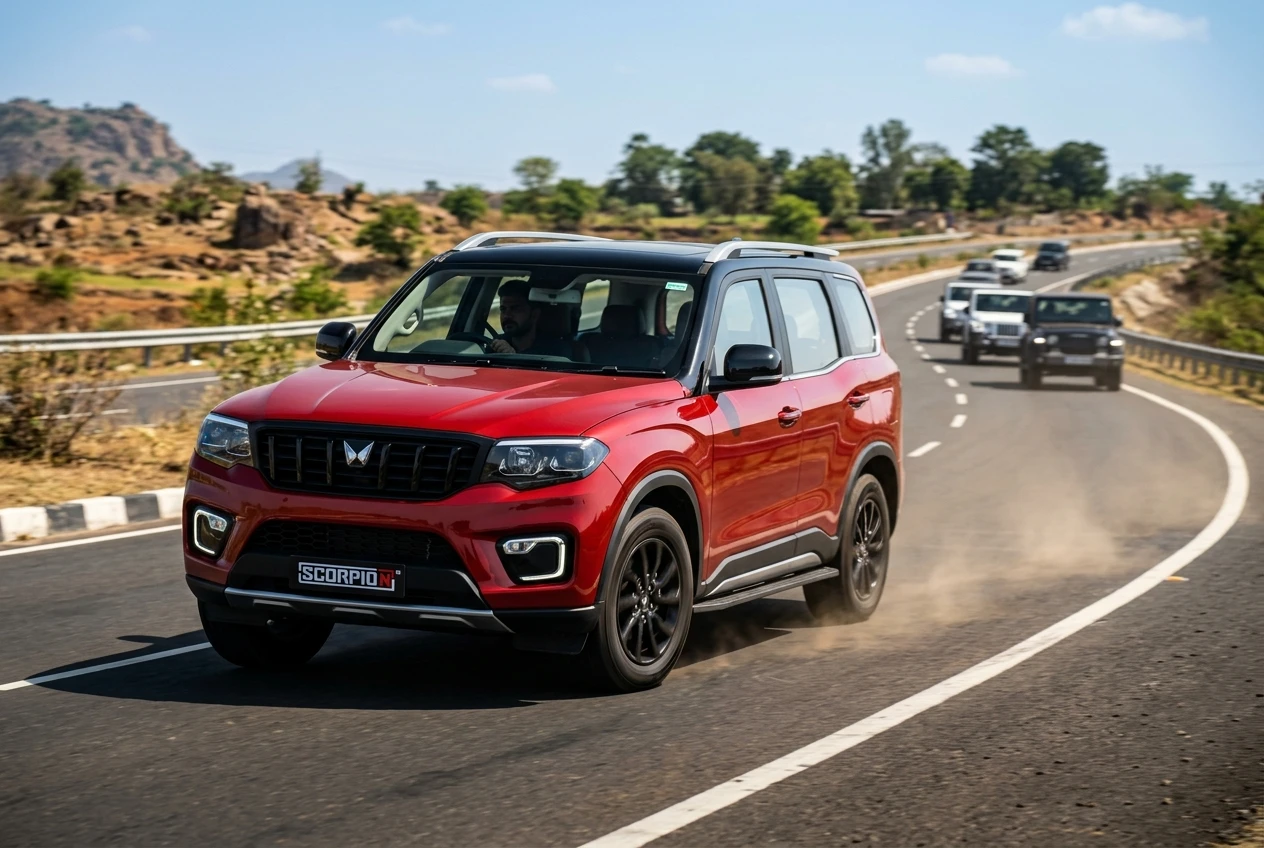
The updated Scorpio N is expected later in August. Dealers already have early units. Festive-season bookings typically lift utility-vehicle demand from mid-August through October. A fresh flagship nameplate arriving into that window gives Mahindra a second lever after the price action.
- 10 July 2026, SUV and CV price increases take effect
- 1 August 2026, July sales release confirms 60k+ SUVs again
- Mid-to-late August 2026, Scorpio N update arrives at dealers
- Festive window, traditional demand surge for utility vehicles
Capacity and supplier manning remain the practical constraints. Earlier months flagged occasional shortages. The company has kept monthly SUV output in a tight band near 60,000 for three months running.
Holding volume through a mid-month price rise is the harder test. Buyers who wanted a Mahindra utility vehicle in the second half of July paid more and still took delivery. That leaves the August Scorpio N refresh as upside on top of a base that already cleared the hike.
The festive window from mid-August through October is the next demand test. A refreshed flagship landing just as bookings traditionally rise is deliberate timing. Constraints on capacity and supplier manning will decide how much of that seasonal lift the factories can convert.
What the First Four Months of FY27 Already Show
April-July passenger vehicles at 234,793 units put Mahindra on a 16 percent growth trajectory. The same period last year was 201,938. Commercial and last-mile mobility lines are growing faster. Exports are up 60 percent year to date. Tractor volumes track rural recovery.
Tata’s sharper YoY passenger-vehicle jump reflects a lower base and strong EV and Punch demand. Mahindra’s absolute SUV machine and the parallel commercial-farm complex produce a different risk profile: less dependent on any single hatch or compact SUV cycle, more exposed to rural cash and freight activity.
On X, market watchers noted Maruti’s dominance and Tata’s EV lead (roughly 12,750 versus Mahindra’s 7,274 in one fan tally of July EV cars). The diversification point received less attention. That is the quiet edge. When passenger demand softens, the LCV, three-wheeler and tractor books keep the factories busy.
Four-month run rates already sketch the shape of the year. Passenger vehicles up 16 percent. Three-wheelers up 69 percent year to date. Exports up 60 percent. Domestic tractors up 19 percent. The lines that pure car rivals lack are the ones growing fastest.
| Channel | YTD Signal | YoY Pace |
|---|---|---|
| Passenger vehicles | 234,793 units | 16 percent |
| Three-wheelers | 50,793 units | 69 percent |
| Exports | 19,958 units | 60 percent |
| Domestic tractors | 185,069 units | 19 percent |
How the Multi Segment Mix Changes the Risk Profile
Pure passenger-vehicle makers live and die by hatch, sedan and compact-SUV cycles. Mahindra’s July sheet shows a different geometry. Domestic SUVs at 60,048 were the largest single block, yet they were only one piece of a 103,860-vehicle auto total and sat beside a separate 32,643-unit domestic tractor print.
The risk trade is explicit in the numbers already on the table. Mahindra is less tied to any single passenger nameplate. It is more tied to rural cash flows, freight activity and last-mile demand. When those channels are healthy, as they were in July, total growth outruns the SUV line. When they weaken, the SUV floor still has to carry more of the load.
- SUV base near 60,000 supplies volume stability
- LCV and three-wheeler growth supplies the upside torque
- Tractors and trucks link the P&L to farm and infrastructure cycles
- Exports at 47 percent July growth and 60 percent YTD add a third geography
Tata’s July passenger-vehicle edge of 2,563 units and its clearer EV lead matter in the passenger scoreboard. They matter less once commercial vehicles, three-wheelers, tractors and trucks enter the frame. That is the comparison pure car scoreboards miss.
Why Total Auto Growth Outran the SUV Line
The six-point gap between 20 percent SUV growth and 26 percent total auto growth is arithmetic, not spin. Domestic SUVs rose from 49,871 to 60,048. The rest of the auto mix (LCVs, three-wheelers and exports) rose faster still, pulling the blended total to 103,860 and a 26 percent gain.
Three-wheelers at 53 percent and LCVs under 2 tonnes at 40 percent did the heaviest relative lifting. The larger 2-to-3.5-tonne LCV band at 21 percent and exports at 47 percent added absolute units on top. No single segment had to spike for the company-wide number to clear the SUV rate.
Gollagunta’s phrase “all-round demand traction across the portfolio” maps directly onto that split. The portfolio is the mechanism. A flat-ish SUV month still becomes a strong auto month when commercial and last-mile lines run hot. That is the structural point the July release keeps making, month after month, in plain volume.
Frequently Asked Questions
How many SUVs did Mahindra sell in July 2026?
Mahindra sold exactly 60,048 utility vehicles in the domestic market in July 2026, up 20 percent from 49,871 in July 2025. Including exports the SUV total was 60,887 units.
Did Tata or Mahindra sell more passenger vehicles in July?
Tata Motors sold 62,611 domestic passenger vehicles, edging Mahindra’s 60,048 by 2,563 units. Both trailed Maruti Suzuki’s 196,203 by a wide margin.
Which Mahindra segments grew fastest in July 2026?
Three-wheelers including electric models rose 53 percent to 14,538 units. Light commercial vehicles under 2 tonnes grew 40 percent. Exports rose 47 percent and domestic tractors rose 21 percent.
What is Mahindra’s passenger-vehicle total for April-July FY27?
Mahindra sold 234,793 passenger vehicles in the first four months of FY27, a 16 percent increase from 201,938 units in the same period of the prior year.
When does the updated Scorpio N reach buyers?
The refreshed Scorpio N is scheduled for dealer arrival in August 2026, positioning it ahead of the main festive buying window.

-
 TECH1 year ago
Where Garmin Watches are Made and How They are Assembled
-
 AUTO3 months ago
Tesla’s Roadster Is ‘a Few Weeks Away,’ Says Its Chief Designer
-
 NEWS10 years ago
Samsung Releases Galaxy Note7 TV Ad as Reddit AMA Leaks Specs
-
 NEWS10 years ago
Android 7.0 Nougat Rolls Out To Nexus Devices With New Emoji, Features
-
 FINANCE9 years ago
Cardano Price Surges as ADA Enters the Crypto Top Ten List
-
 NEWS10 years ago
Pre-Order the First Camera Made for Facebook Live Streaming Video
-
 FINANCE1 year ago
Binance Suspends Trading and Withdrawals for a System Upgrade
-
 FINANCE9 years ago
RChain Price Jumps Nearly 150% to a New All-Time High of $2.03