
BUSINESS
MoU Oil Surge Cleared Tankers but Left Hormuz Darker
Kpler data show 374 million barrels exited the Gulf at 6.1 mbd during the expired US-Iran MoU.

Some 374 million barrels of oil exited the Gulf at an average 6.1 million barrels per day during the 60-day US-Iran Memorandum of Understanding, nearly triple the 2.3 million bpd rate that held from April until the deal was signed on June 17, according to ship-tracking firm Kpler. The window closed on August 17 with no peace agreement and no extension.
That surge never restored the strait. Volumes reached only about 40 percent of the roughly 15 million barrels that moved through the Strait of Hormuz each day in 2025. More than half the barrels left in the first three weeks. By the end the flow was thinner, darker and re-accumulating behind the chokepoint, Kpler’s Emmanuel Belostrino said.
The arithmetic is blunt. A clearance rate that looked dramatic against the blockade baseline still left the system operating far below the pre-war lane. The MoU bought time and emptied a backlog. It did not rebuild a transit regime operators would trust.
The Window Cleared Ships, Not the Strait
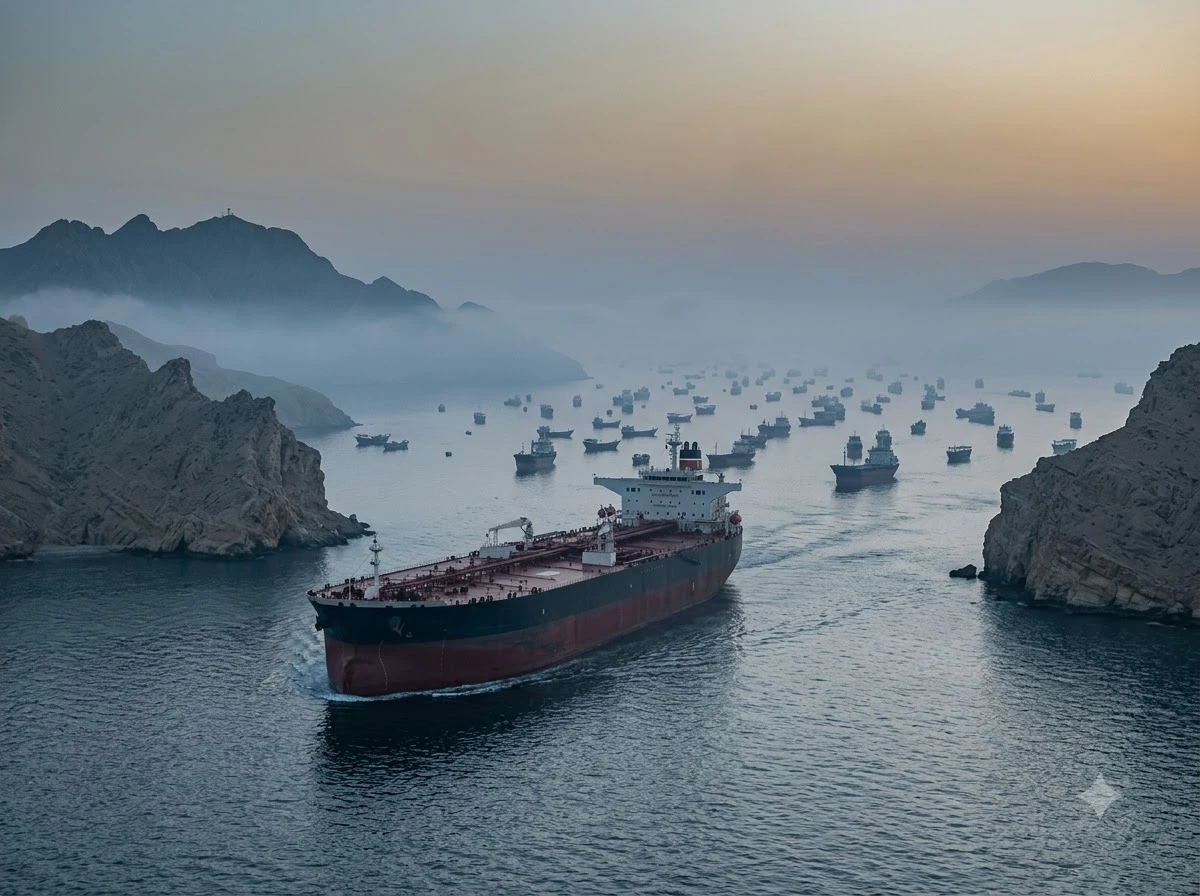
The war that began in late February closed the waterway that once carried about one-fifth of global oil supply. Laden tankers stacked up inside the Gulf. Idle floating storage of crude peaked near 104 million barrels in late April and still stood at 61 million barrels when the Islamabad MoU was signed.
Within three weeks the temporary free-passage rules cut that floating storage to 16 million barrels. The early numbers largely reflect ships that had been stuck finally getting out. Total crude on water inside the Mideast Gulf and Gulf of Oman system fell from 165 million barrels at signing to 107 million by early July, then stopped falling. It closed the window near 130 million barrels, still above the roughly 96 million barrels seen at the war’s start.
- 374 million barrels of crude clearance across the full MoU window
- 6.1 million bpd average rate, versus 2.3 million bpd pre-MoU
- ~40 percent of 2025 Hormuz average of roughly 15 million bpd
- ~550 million barrels shortfall against normal flows, with the bill due in Q4
Kpler’s combined measure of non-Iranian Hormuz transits plus Gulf of Oman net exports produced the 374 million barrels cleared the Gulf. Total liquids and LPG crossings averaged higher, about 8.8 million bpd. The physical system that creates stranded cargo never healed.
The draw in floating storage and the later rebound on water mark two different phases of the same failed repair. Early weeks drained what the blockade had trapped. Later weeks showed fresh cargo again stacking behind a chokepoint that still could not be used at scale.
How the Numbers Broke Down Week by Week
Clearance ran strong while visibility lasted, then faded as dark and unattributed cargoes returned. In the third week 95 percent of barrels leaving the Gulf could be traced to the terminal that loaded them. In the final week only 34 percent could.
| Period | Approx. crude clearance | Key marker |
|---|---|---|
| Pre-MoU (Apr-mid Jun) | 2.3 mbd average | Blockade era |
| MoU weeks 1-3 | Majority of total 374 mb | Floating storage draw to 16 mb |
| Later MoU weeks | Thinning, dark share rising | Unattributed share to 66% |
| 2025 full year | ~15 mbd Hormuz | Pre-war baseline (Kpler) |
| Historical EIA range | ~20 mbd recent years | historical chokepoint transit volumes |
The southern Omani corridor opened under guidance on 20 June, peaked at 48 crossings in week 2, and was effectively gone by week 4 after attacks. The standard IMO route fell to zero from week 5. What remained was a fading Iranian route and a dark or unknown share that never dropped below 44 percent and closed above 80 percent. LPG crossings hit zero for a stretch; LNG carriers ran dark after a multi-week halt.
Route collapse and attribution collapse moved together. Once the Omani lane and the IMO lane were gone, the residual flow was both smaller and harder to assign. That is the thinner, darker pattern Belostrino described at the close of the window.
Six Dates That Undid the Commitments
Every operative promise frayed inside the first month. The pattern was symmetrical: each side withdrew a headline concession and blamed the other.
- 17 June 2026, Islamabad MoU signed: 60-day free safe passage, US blockade lift within 30 days, oil-export waivers. OFAC issues General License X days later.
- 7-8 July, LNG carrier AL REKAYYAT and tanker WEDYAN attacked. OFAC revokes the waiver (wind-down to 17 July). US retaliatory strikes. Day 20 of 60.
- 12-14 July, GFS GALAXY, MOMBASA B and AL BAHYAH struck. Southern Omani route never recovers. US reimposes naval blockade of Iranian ports. Day 27.
- 20-25 July, Houthis declare maritime embargo on vessels serving Saudi ports; Jizan refinery struck. Binding constraints shift to mines, war-risk insurance and IRGC interdiction.
- 4 August, Tehran approves dual-lane transit framework on a separate 60-day clock with zero tolls and promised mine clearance. Clearance rallies briefly; mine work never starts.
- 17 August, Window lapses at midnight. Tehran asserts permit-and-toll regime; Washington rejects it and keeps escorts and blockade enforcement. Brent crosses $90.
Iranian Foreign Minister Abbas Araghchi said Tehran “never had a ceasefire that would now need to be extended.” President Trump answered “No” when asked about an extension. On expiry day both sides declared the other’s violations had nullified the arrangement.
Read against the calendar, the MoU’s operative life was far shorter than its 60-day text. The waiver survived 20 days. The blockade lift survived 27. Mine clearance never began. The dual-lane framework arrived late and changed little on the water.
Seafarers Keep Paying for the Impasse
Five commercial vessels were attacked in the strait over the week before the MoU expired, UKMTO reported. A Liberia-flagged bulk carrier, Minoan Dignity, was struck by an unknown projectile off Oman on 17 August. One seafarer died, the first confirmed death since July.
INTERCARGO identified the mariner as a crew member and said: “Behind every vessel caught up in conflict are seafarers, civilians carrying out their professional duties, far from their homes and families, who keep global trade moving.” The group repeated that seafarers must never become targets or collateral victims.
- At least 18 seafarers killed in regional commercial-vessel attacks since the late-February start of the US-Israel war on Iran, per the International Maritime Organization
- Iranian forces claimed or were blamed for dozens of attacks
- US forces acknowledged roughly half a dozen, including a June 10 strike that killed three Indian seafarers on a Palau-flagged tanker
- Lloyd’s List Intelligence recorded 73 transits 10-16 August, down from 91 the prior week
No government or group claimed the Minoan Dignity attack. The human cost continues while the diplomatic ledger stays empty.
Transit counts and casualty counts now move on separate tracks from the expired text. Crews still face the risk that produced the Minoan Dignity death on the final day of the window. The diplomatic file holds no extension and no new protection framework.
Markets Already Stopped Waiting for a Reopening
Brent crude futures edged higher the morning after the story broke, trading near $91.93 early Thursday before later prints moved into the mid-90s on some platforms. Tim Waterer, chief market analyst at KCM Trade, told Al Jazeera the market is unconvinced by more optimistic US administration talk on passage security.
“Until there is clearer evidence of sustained, safe transit and a more durable diplomatic framework, confidence among operators is likely to stay low and volumes are unlikely to recover meaningfully,” Waterer said.
Final-week loadings near 4.9 million bpd ran against confirmed clearance of only 2.3 million bpd. Ballast entries into the Gulf fell to about two per day. Operators are not positioning for a quick return to normal. Analysts note that secret or dark flows have so far kept prices from the extreme scenarios some had modeled near $350 if the strait had stayed fully shut with depleted inventories. The prevailing view treats full restoration as low-probability near term.
Brookings described the overall war-era disruption as the largest supply disruption on record, with IEA estimates earlier putting affected outputs down more than 14 million bpd at peak. Pipelines such as Saudi East-West and UAE Habshan-Fujairah have run hard, yet the gap remains large.
| Signal | Late-window reading | What it implies |
|---|---|---|
| Final-week loadings | ~4.9 million bpd | Cargo still offered into a constrained lane |
| Confirmed clearance | ~2.3 million bpd | Exit capacity far below loadings |
| Ballast entries | About two per day | Operators not restocking the Gulf fleet |
| Brent after expiry | Near $91.93, then mid-90s | Price path tracks thin safe transit, not diplomacy |
The loading-to-clearance gap is the market’s working assumption in physical form. Ships can be filled faster than the strait will release them. Until that ratio changes, price talk about reopening remains secondary to insurance, routing and escort reality.
Why Dark Flows Never Became a Full Fix
Dark and unattributed cargoes rose as formal routes failed. That share never fell below 44 percent during the window and closed above 80 percent. In the third week, 95 percent of exiting barrels could still be tied to a loading terminal. By the final week the traceable share was 34 percent, leaving 66 percent unattributed.
Those opaque movements matter because they limited how high prices climbed. Analysts link the absence of the most extreme modeled outcomes, including scenarios near $350 under a fully shut strait with depleted inventories, in part to secret or dark flows that continued when declared lanes did not.
Opacity is not the same as capacity. LPG crossings fell to zero for a stretch. LNG carriers ran dark only after a multi-week halt. Total crude clearance across the full MoU still averaged just 6.1 million bpd against a 2025 Hormuz baseline near 15 million bpd. Dark barrels softened the price spike. They did not close the volume gap.
- Traceable share in week 3: 95 percent of exiting barrels
- Traceable share in the final week: 34 percent
- Dark or unknown floor during the window: 44 percent
- Dark or unknown share at the close: above 80 percent
Operators reading those figures see a market that can hide some barrels and still cannot move a normal slate. The same data that capped the upside in futures also explain why ballast traffic into the Gulf collapsed to roughly two ships a day.
The Shortfall Lands in the Fourth Quarter
Inventory draws and the temporary buffer from the truce window have bridged the shortfall so far. Those cushions thin from September. The larger physical gap, roughly 550 million barrels of crude against normal Hormuz volumes, lands in the fourth quarter.
The MoU’s 374 million barrels of clearance were never going to erase a deficit of that size. More than half of that total left in the first three weeks, when floating storage was still being drained from 61 million barrels toward 16 million. Once the backlog was gone, the underlying transit rate could not keep pace with a normal Hormuz slate.
Pipelines such as Saudi East-West and UAE Habshan-Fujairah have run hard through the war era. Hard pipeline runs did not remove the need for the waterway that once carried about one-fifth of global oil supply. Brookings still frames the disruption as the largest on record. IEA figures earlier put peak affected output above 14 million bpd.
- Late April: idle floating storage peaks near 104 million barrels under blockade conditions.
- 17 June: MoU signing, floating storage still about 61 million barrels, crude on water about 165 million.
- Early July: crude on water falls to 107 million, then the decline stalls.
- 17 August: window ends with crude on water near 130 million, above the roughly 96 million barrels at the war’s start.
- September onward: inventory and truce buffers thin; the ~550 million barrel gap is timed for Q4.
That sequence is why traders treat full restoration as a low-probability near-term event. The calendar now matters more than the expired clauses. Cushions that absorbed the first half of the deficit are the same cushions that run down as Q4 approaches.
Iran Ends the Window Exporting Less Than During the War
While non-Iranian Gulf cargoes moved, Iranian crude loadings collapsed from 893,000 bpd in July to 156,000 bpd through 17 August. The US oil waiver lasted only 20 of the 60 days. The blockade lift lasted 27. Iran’s mine-clearance obligation was never completed.
Tehran now asserts a permit-and-toll regime. Washington rejects any charge for passage it insists remains free under international practice. The argument has moved past the original MoU text. Chinese teapots showed limited appetite even during the temporary sanctions relief, limiting how quickly Iranian barrels could monetize.
The MoU solved one of the two stacked problems the war created. Stranded ships got out. The flow system that generates new stranded cargo and dark routing is still in place and was already refilling as the clock ran out. Inventory draws and the temporary buffer from the truce window have bridged the shortfall so far. Those cushions thin from September. The larger physical gap, roughly 550 million barrels of crude against normal Hormuz volumes, lands in the fourth quarter.
Operators, insurers and traders are acting on the thinner, darker reality the data already show rather than on any remaining diplomatic language.

-
 TECH1 year ago
Where Garmin Watches are Made and How They are Assembled
-

 AUTO3 months ago
Tesla’s Roadster Is ‘a Few Weeks Away,’ Says Its Chief Designer
-
 NEWS10 years ago
Samsung Releases Galaxy Note7 TV Ad as Reddit AMA Leaks Specs
-
 NEWS10 years ago
Android 7.0 Nougat Rolls Out To Nexus Devices With New Emoji, Features
-
 FINANCE9 years ago
Cardano Price Surges as ADA Enters the Crypto Top Ten List
-
 NEWS10 years ago
Pre-Order the First Camera Made for Facebook Live Streaming Video
-
 FINANCE1 year ago
Binance Suspends Trading and Withdrawals for a System Upgrade
-
 FINANCE9 years ago
RChain Price Jumps Nearly 150% to a New All-Time High of $2.03