NEWS
Delhi Diwali AQI Missed the Night Peaks at 1,000
Delhi’s official Diwali AQI stayed Very Poor because PM2.5 feeds went blank at 1,000, the hours GRAP uses to judge the emergency.

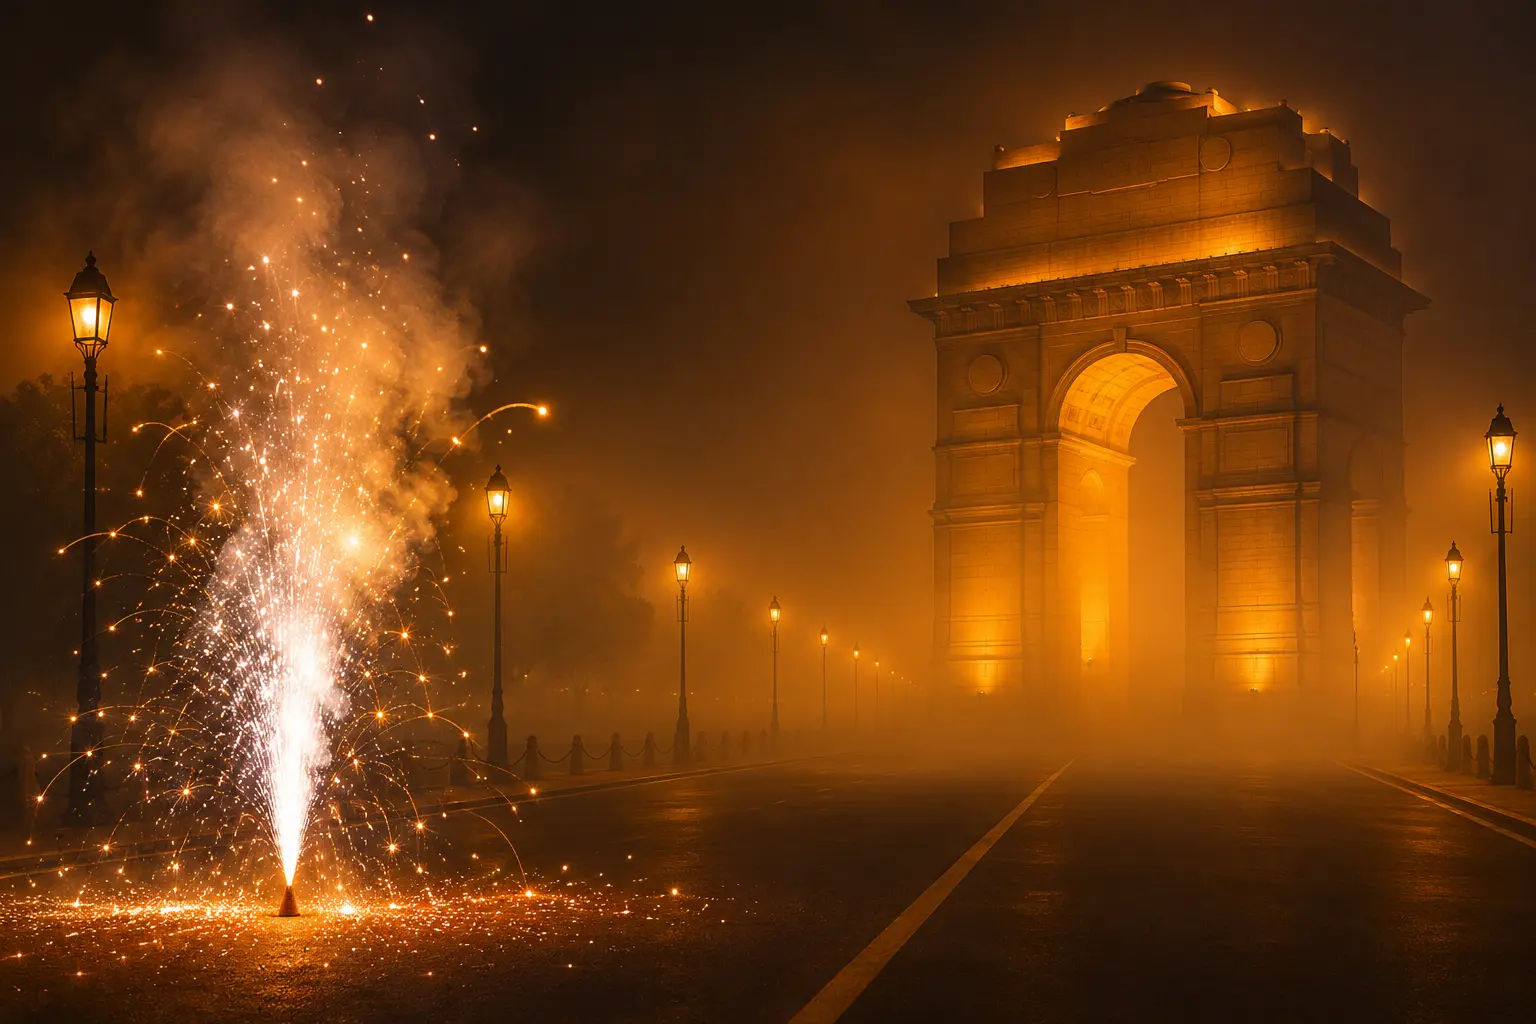
Delhi’s official Diwali AQI was 376 on Sunday, 8 November 2026, then 344 the next day, both in the Very Poor band, after PM2.5 feeds went blank at 1,000. Firecracker hours are when the city’s emergency plan most needs a full record, and those are the hours the Central Pollution Control Board portal did not publish.
Stage III curbs were already in force from 6 November. The citywide bulletin never crossed 401, the line where the daily index is labelled Severe, because the night peaks were missing from the average that bulletin uses.
PM2.5 Hit 1,000, Then the Feed Went Dark
EnviroCatalysts, a Delhi think tank, said at least 19 Delhi Pollution Control Committee stations logged particulate matter smaller than 2.5 microns, PM2.5, above 1,000 micrograms per cubic metre late on Sunday and early on Monday. The CPCB feed, which is meant to take those readings in, showed no values from those stations for the matching hours.
Sunil Dahiya, founder and lead analyst at EnviroCatalysts, said the gaps suggest the CPCB figures “understate the air pollution crisis in the capital.” He said the board appeared to drop extremely high PM2.5 values, “such as 1,000 micrograms per cubic metre or higher,” while keeping even “absurdly low” ones.
From 10pm on Sunday to 4pm on Monday, the 59 stations across Delhi should have produced 1,062 hourly readings. Two hundred and fifty-eight of those points, about 24 percent, are missing from the CPCB data.
Manoj Kumar, an analyst at the Centre for Research on Energy and Clean Air, counted 227 missing hourly PM2.5 observations from midnight on 8 November until 5am on 9 November. Only 14 of 59 stations sent a complete set. The other 45 had at least one blank hour. “When the hourly PM2.5 data is missing, it will artificially lower the AQI, showing better air quality when the actual air quality is worse,” Kumar said.
THE NIGHT THE STATIONS DROPPED OUT
- 7pm, 8 November: One station has missing data as the evening begins.
- 10pm, 8 November: Seven stations are blank as bursting peaks.
- Midnight: Twenty-nine stations are not reporting.
- 2am, 9 November: Twenty-three stations still send no reading.
A Centre for Research on Energy and Clean Air review found more than 20 stations failed to report from around midnight to 2am, the window when smoke sits in a shallow night layer. CPCB Central Control Room records for the full 59-station set show 43 had a PM2.5 gap between 10pm and 6am. At 14 of those 43, the last number before the gap was 900 or more.
This was not a citywide power cut. Stations that lose current stop sending every channel. Through the same night they kept sending nitrogen dioxide, carbon monoxide and ozone. The dust channel died as it neared the cap. Monday’s city bulletin was built from 47 of the 59 stations.
Why the Analysers Stop at 1,000
No published Delhi PM2.5 reading went past 1,000 this Diwali. The highest values that reappeared after the gaps were exactly 1,000.0, at Sirifort and ITO. D. Saha, former head of the CPCB air quality laboratory, said the board set the measurement range of PM2.5 analysers at 0 to 1,000 micrograms per cubic metre, so they cannot report concentrations above that level.
If hourly PM2.5 or PM10 value is blank or missing, it will affect the AQI calculated and the final value of the AQI calculated will be less than the actual value of AQI and scientifically incorrect.
D. Saha, former head, CPCB air quality laboratory
Saha said that if PM2.5 is beyond 1,000, “it should at least be shown as 1,000 instead of showing blank.” A former Delhi Pollution Control Committee scientist, speaking without being named, said the cap exists because accuracy dips a little at very high loads, and that a small dip at those levels does not justify losing the peak.
Procurement sheets for Indian continuous stations state a PM2.5 measuring range of 0 to 1,000 micrograms per cubic metre on beta-attenuation analysers. That specification matches the wall the public feed hit on Sunday night. Last Diwali, an OpenAQ copy of the CPCB live feed showed 29 of 39 comparable Delhi stations with at least one hour above 1,000, and a high of 2,224 at NSIT Dwarka. This year the same kind of network stopped at the round thousand and went dark.
The climb was steep, then empty. At the Indian Institute of Tropical Meteorology’s North Campus site, PM2.5 rose from 326 at 8pm to 999 at 10pm, after which the next hours were blank. ITO, a CPCB station, last sent 994 at 10.45pm. Anand Vihar hit 767 at 11pm, then three hours vanished. Patparganj peaked at 930 at 10pm and then went quiet for three hours. PM10, the coarser dust measure, dropped out earlier and further, which is what a 1,000 cap would do first because PM10 runs higher than PM2.5 in the same air.
The 24-Hour Average Drops the Worst Hours
India’s public index is not an hourly photograph. Saha said AQI is a moving average of hourly concentrations of eight pollutants, including PM2.5 and PM10, over the previous 24 hours. The National Air Quality Index calculation method, drawn up by the CPCB with IIT Kanpur, converts each pollutant to a sub-index and reports the highest valid sub-index as the AQI.
A station needs at least three pollutants, one of them PM2.5 or PM10, and at least 16 hours of valid data for a 24-hour sub-index. Hours that are blank do not go in as 1,000. They drop out, so the average is built from the hours that remain, most of them outside the worst stretch. Stations that stay blank too long fall out of the city figure altogether.
HOW THE GAPS PULL THE INDEX DOWN
- The cap: Analysers and the public feed stop at 1,000 micrograms per cubic metre and publish a blank instead of a floor value.
- The average: Each station’s PM2.5 sub-index uses a 24-hour mean, so missing the spike hours lowers that mean.
- The 16-hour cut: A station with too many blanks no longer counts in the city AQI at all.
- The city number: Delhi’s bulletin is an average of the stations that still qualify, which on Monday was 47 of 59.
That is why a night of extreme dust can still print as Very Poor, 301 to 400, the morning after. CPCB’s Severe band starts at 401, which on the PM2.5 scale maps to a 24-hour mean of 251 micrograms per cubic metre. Several stations were reading close to 1,000 just before they vanished. The index that the public saw never had those hours to work with.
Radhey Shyam Sharma, head of environmental studies at Delhi University, said an average AQI can differ a lot from peak pollution, “particularly during the hours when residents were exposed to the highest concentrations of pollutants.” He said official data should state location and time clearly, because private sensors do not always average the same way, and missing readings create confusion about what people actually breathed.
Stage III Held While Stage IV Stayed Out of Reach
The Commission for Air Quality Management already had its four-stage Graded Response Action Plan on Stage III from 6 November, after Delhi’s AQI reached 382 and weather models pointed to a Severe spell around the festival. That 382 sat 19 points under 401. The commission may invoke a stage early when a forecast says the higher band will last, and it did.
The blanks on Diwali night did not decide whether Stage III would start. They decided what the official daily number looked like while Stage III was running, and whether Stage IV, AQI above 450, ever came into view. Sunday’s bulletin of 376 and Monday’s of 344 both stayed in Very Poor. Local morning readings on Monday did not: Burari Crossing was 441, Vivek Vihar 437, Delhi Technological University 434.
GRAP BANDS THE DAILY AQI FEEDS
- Stage I, Poor, 201 to 300: Dust rules, waste-burning bans, traffic and PUC enforcement, in force from 21 October.
- Stage II, Very Poor, 301 to 400: Extra sweeping and sprinkling, higher parking fees, staggered office hours, in force from 2 November.
- Stage III, Severe, 401 to 450: Non-essential construction stopped, BS-III petrol and BS-IV diesel cars restricted, hybrid classes up to Class 5, invoked 6 November.
- Stage IV, Severe Plus, above 450: Heavier vehicle and industrial curbs that the citywide bulletin never reached.
Schools, builders and traffic police take their cue from that ladder, not from a private sensor on a balcony. The SAMEER app and the CAQM site tell residents which stage is live. If the citywide 24-hour figure is built without the firecracker hours, the ladder is climbing on a shaved rung. The Supreme Court allowed certified green crackers only from 6am to 7am and 8pm to 10pm on 7 and 8 November. The smoke still arrived. The official average still fell on Monday, a dip experts called unusual because cracker emissions usually worsen the day after Diwali.
Six Diwali Mornings on the Official Scale
On the CPCB bulletin, Sunday was Delhi’s most polluted Diwali day in five years, meaning the highest festival-day AQI since 2021. The next-day figure of 344 was lower, the same direction as 2022 and the opposite of most years in this run, when the morning after printed worse than the festival day.
OFFICIAL DELHI AQI, DIWALI DAY AND THE DAY AFTER
| Year | Diwali date | Diwali-day AQI | Next-day AQI |
|---|---|---|---|
| 2026 | 8 November | 376 | 344 |
| 2025 | 20 October | 345 | 351 |
| 2024 | 31 October | 328 | 339 |
| 2023 | 12 November | 218 | 358 |
| 2022 | 24 October | 312 | 302 |
| 2021 | 4 November | 382 | 462 |
The 462 bulletin after Diwali 2021 remains the worst post-festival official reading of this decade. A fall the morning after is not unheard of, 2022 also dropped, but it is the exception. In a year when 43 stations had night gaps and 19 DPCC sites had already seen PM2.5 above 1,000, a 32-point official decline from 376 to 344 is the number the record will keep, not the hours the portal skipped.
The Exposure the Index Never Shows
The World Health Organization’s 24-hour PM2.5 health guideline is 15 micrograms per cubic metre. India’s national 24-hour standard is 60. A published hour at 1,000 sits far above both. Fine particles at that size go deep into the lung and into the blood. The index that told Delhi the air was Very Poor on Monday was a 24-hour composite. The hours when children were still outside, and when night workers were on the road, were the hours that went missing.
Anumita Roychowdhury, executive director at the Centre for Science and Environment in New Delhi, called the gap a failure of the record the city needs for any later reckoning.
A data eclipse during peak Diwali pollution is inexplicable. While the severity of exposure is evident on the ground, credible official data is needed for institutional accountability, public awareness and mitigation. Losing data doesn’t reduce the public health emergency.
Anumita Roychowdhury, executive director, Centre for Science and Environment
Sharma said transparency and accountability matter in a “severe emergency,” and that missing readings leave people unsure of the levels they were exposed to. The political argument that filled the hours after the festival did not settle that point. It moved to crackers versus farm fire. Delhi Labour Minister Kapil Mishra said satellite counts of stubble burning in Punjab jumped from 125 locations on 7 November to 1,200 on Diwali night, a rise he called tenfold and a “conspiracy.” Saurabh Bharadwaj, a senior Aam Aadmi Party leader, accused the Delhi government of “data fraud,” alleged that stations were switched off, that 20 new monitors sit in greener, less crowded pockets, and that water was sprinkled near Jahangirpuri to cool a reading. Those last claims have not been independently established.
Stubble plumes and firecracker smoke can both load a winter night. Neither explains a dust channel that dies at 1,000 while the gas sensors on the same boxes keep transmitting. The louder public fight is about who to blame for the smoke. The quieter problem is that the official instrument cannot hold the number when the smoke is worst.
The Portal Has Not Explained the Blanks
The CPCB has not commented on the missing hours or on the Monday decline. Its member secretary did not answer calls or messages seeking comment. Mishra told reporters the government would look into the missing data. As of 10 November the public portal had not published a note on the 1,000 cap, on why blanks replaced a floor value, or on how many station-hours were dropped from the 376 and 344 bulletins.
WHAT WE KNOW
- The cap: Published PM2.5 stopped at 1,000.0 and then went blank, while gas readings continued.
- The count: 258 of 1,062 hours in an 18-hour window are missing; CREA found 227 blanks in the six hours after midnight.
- The rule: Stage III was already on; the citywide bulletins of 376 and 344 stayed below 401.
WHAT IS UNCONFIRMED
- Intent: No public document shows stations were switched off to lower the AQI.
- The 20 new sites: Bharadwaj’s claim that new monitors in open green belts pull the city average down is untested in a published siting audit.
- Jahangirpuri water: The sprinkling allegation has not been independently established.
Until the board says whether a 1,000 reading is treated as invalid, and until the dropped hours are restored or flagged, the official Diwali file is a Very Poor pair of days and a night the analysers could not finish. Stage III remains the rulebook the city is using. The hours that would have tested Stage IV are the ones that never entered the average.
Disclaimer: This article is news reporting and analysis of air-quality measurements, monitoring hardware and public emergency rules. It is informational only and is not medical, legal or regulatory advice. It does not tell anyone whether to go outside, wear a mask, close a school or change treatment. Readers with asthma, heart disease, pregnancy or other conditions should consult a qualified physician before changing activity or care. Station counts, AQI values and GRAP stages reflect the official feeds and named analyses on the dates given and may be revised if agencies restore or correct data.

ADNOC Ship Hit in Hormuz Leaves One Crew Missing

SpiceJet’s Rs 5,500 Crore Plan Follows a Rescue That Failed

Hasina’s Return Fight Sets Fire to Yunus’s Bank

Bancroft Recants the 2018 Inquiry and Names the Team

Adhikari Ties the Saffron Saree Row to School Licences

Clancy Juror Says the Holdout Never Cited Evidence

The iPhone 18 Pro Max Splits Apple’s Fall in Two

OpenAI Calls GPT-6 Astra AGI Then Locks Its Exploits

Trump Claims Hormuz Control as Oil Holds Near $96

Russia Closes the Goethe-Institut Berlin Tried to Save

 NEWS2 months ago
Clancy Juror Says the Holdout Never Cited Evidence
- NEWS3 months ago
The iPhone 18 Pro Max Splits Apple’s Fall in Two
- NEWS3 months ago
OpenAI Calls GPT-6 Astra AGI Then Locks Its Exploits
- BUSINESS3 months ago
Trump Claims Hormuz Control as Oil Holds Near $96
- LIFESTYLE3 months ago
Russia Closes the Goethe-Institut Berlin Tried to Save
- AUTO3 months ago
Volkswagen’s Job Cuts Leave Four Plants Without Cars
- NEWS3 months ago
Dyson Puts Nurovi Robots on Sale Without the UV Flagship
- BUSINESS2 months ago
US Destroys Five Iranian Tankers as the Shock Hits Jordan